Return Trends | Claims and Returns Scorecard
Previously, both suppliers and Walmart spent a lot of time resolving issues because there was little visibility to claims and returns data. Return Trends and the Claims and Returns Scorecard give you and your merchants improved tracking of claims and returns. These insights will help you identify potential issues with the items and discuss them during negotiations.
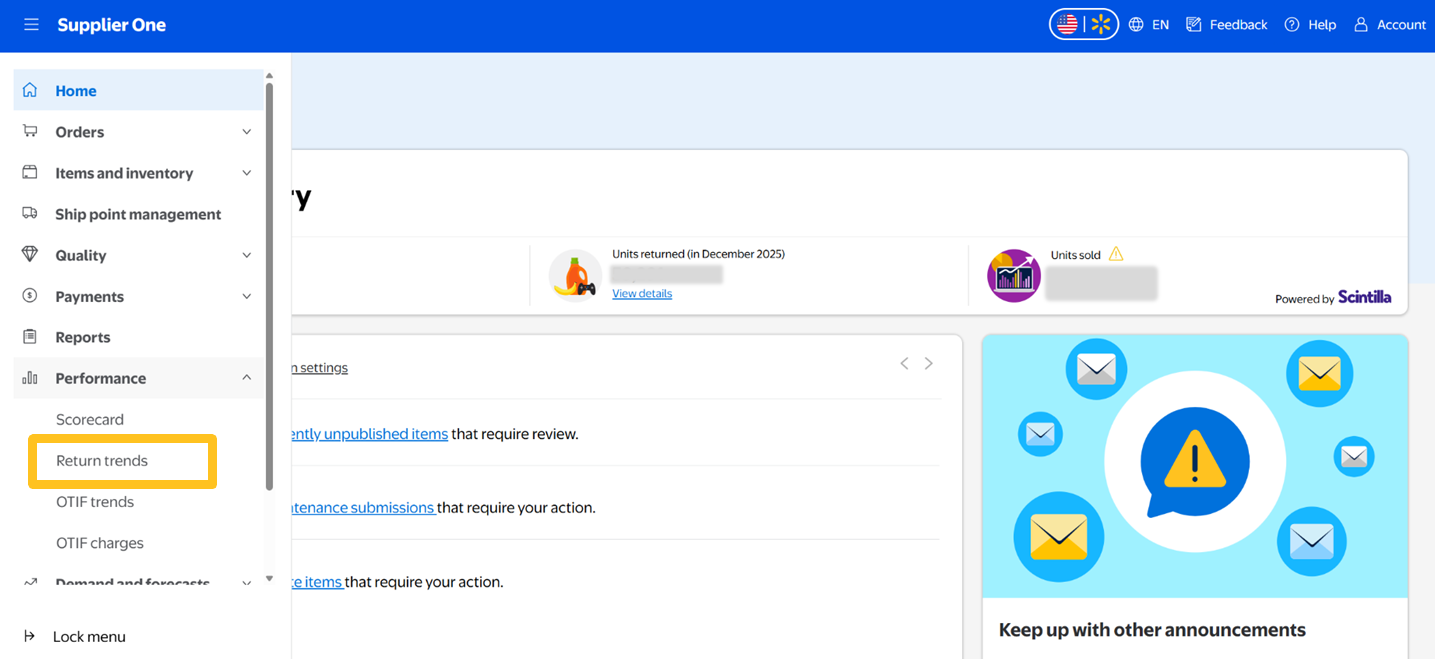
In the left navigation menu of Supplier One, click Performance and select Return trends to view Return Trends and the Claims and Returns Scorecard.
Self-Paced Courses in Supplier Academy
We encourage you to complete these self-paced, on-demand courses in Supplier Academy:
- https://supplieracademy.northpass.com/app/courses/d480cf77-4d8a-4fb2-9994-ac295307a3f2: Gain an understanding of the Claims and Returns Scorecard (CARS) so you can effectively utilize it.
- https://supplieracademy.northpass.com/courses/d480cf77-4d8a-4fb2-9994-ac295307a3f2/activities/41515e8e-a90b-4d21-8cfb-02c116f06c29: This 20-minute course gives you an overview of Walmart's Claims and Returns Scorecard (CARS), including the purpose and scope, basic terminology, navigation steps, how to get support, and help resources.
Owned and/or DSV
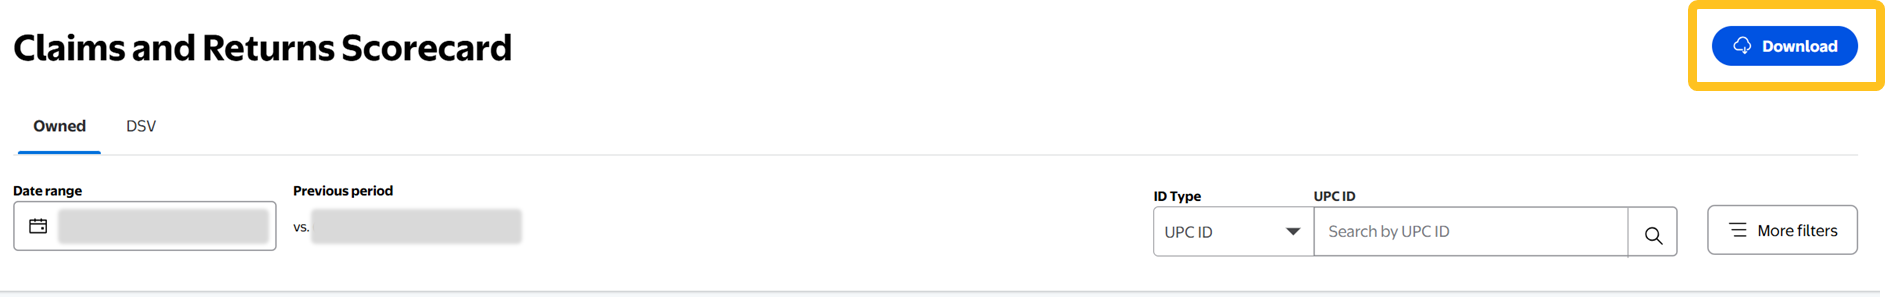
If you have both Owned and DSV orders, you will see tabs for Owned and DSV. Click one of the tabs to view your claims and returns data for all Owned or DSV claims and returns linked to your account.
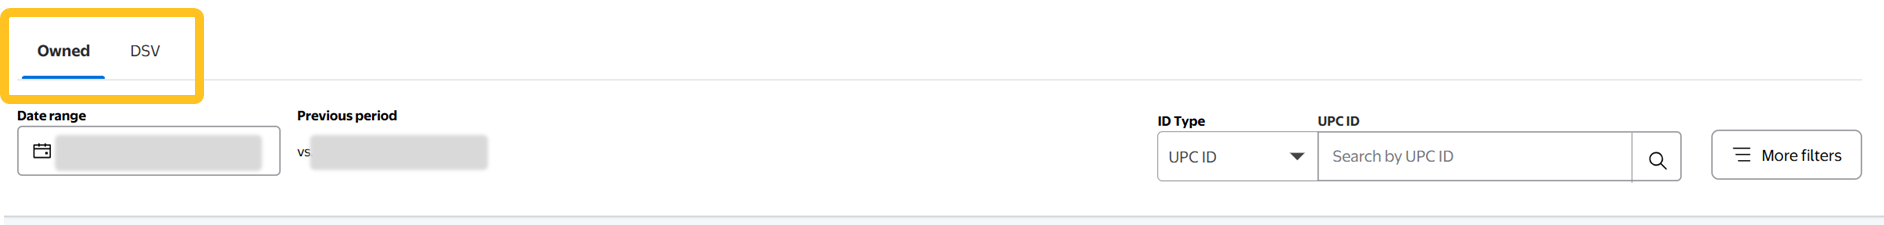
If you only have Owned or DSV orders, you will not see these tabs. The page automatically defaults to all Owned or DSV claims and returns linked to your account.

Supplier ID, Date Type, and Date Range
Before you view returns or claims, you need to select some basic information:
- For DSV only: Select the Supplier ID (if you have multiple) and Date type (Return Date or Order Date).

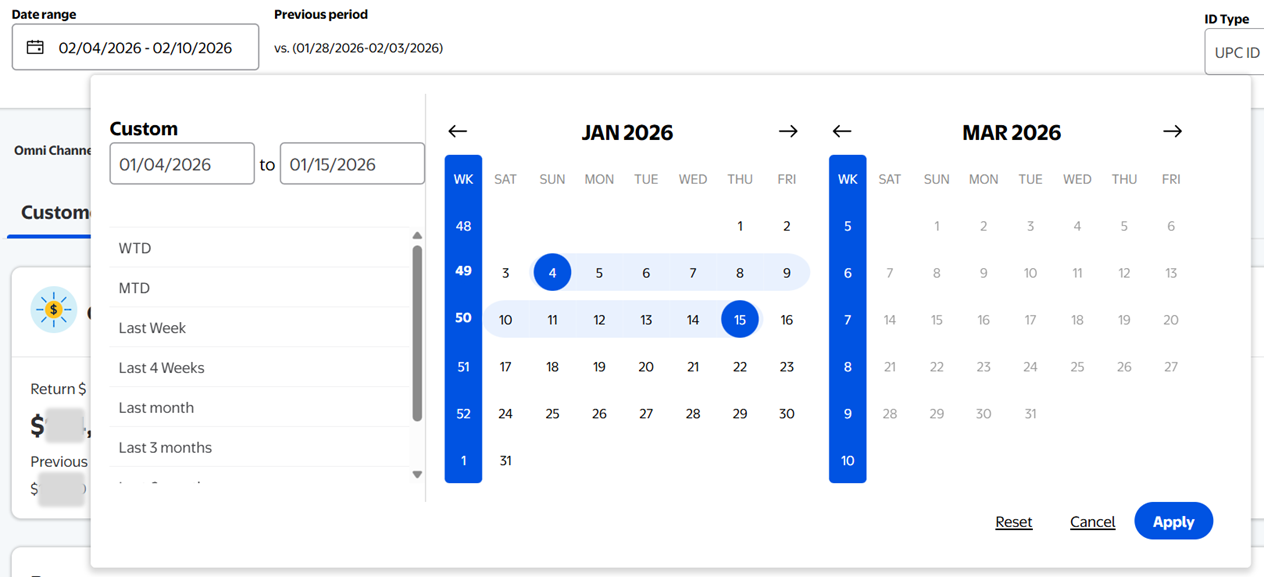
- For Owned and DSV: Select the Date range that you want to look at. You can select up to six months at a time for Owned and up to 1 year for DSV. The scorecard will show data for the selected timeframe compared to the date range under Previous period.
 The calendar resets when you switch between the claims and returns tabs to allow for lags in pulling claims data (i.e., you will need to select the Date range again). You will see this message at the bottom center of your browser window as a reminder.
Item Search
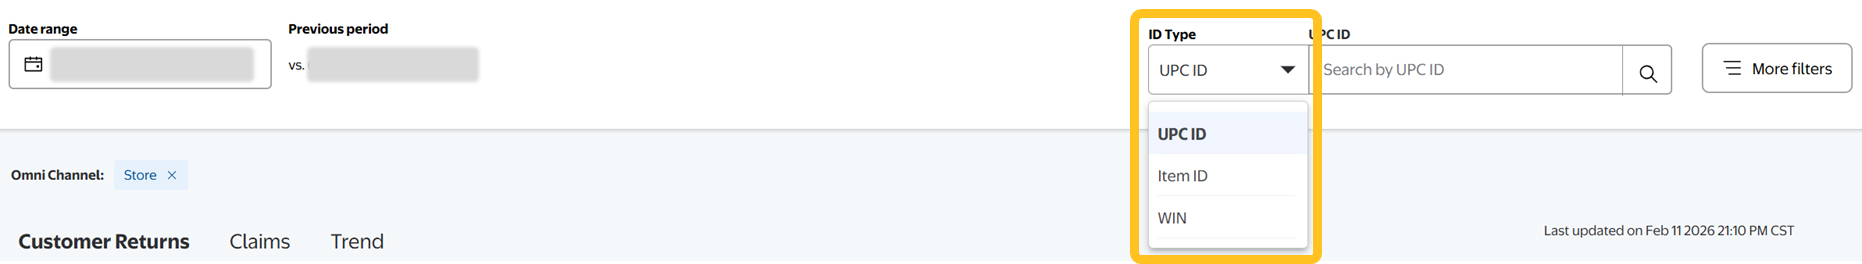
- Select the ID Type (UPC ID, Item ID, or WIN) from the drop-down menu. WIN is only supported for Owned.
- Copy and paste the IDs in the search bar. You can enter multiple IDs separated by commas.
Filters
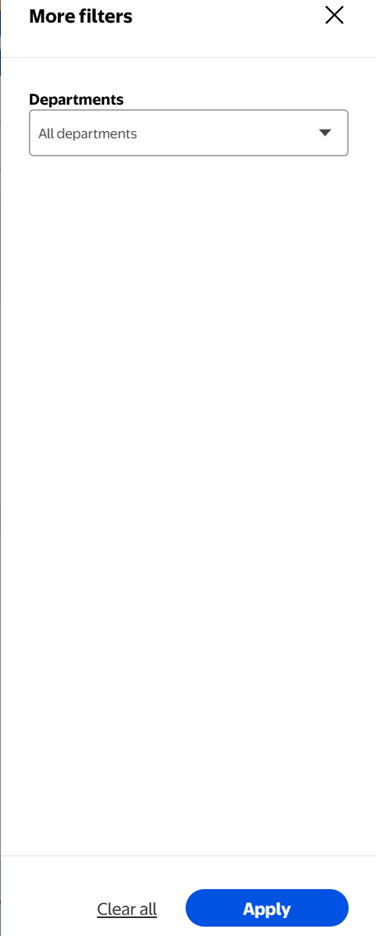
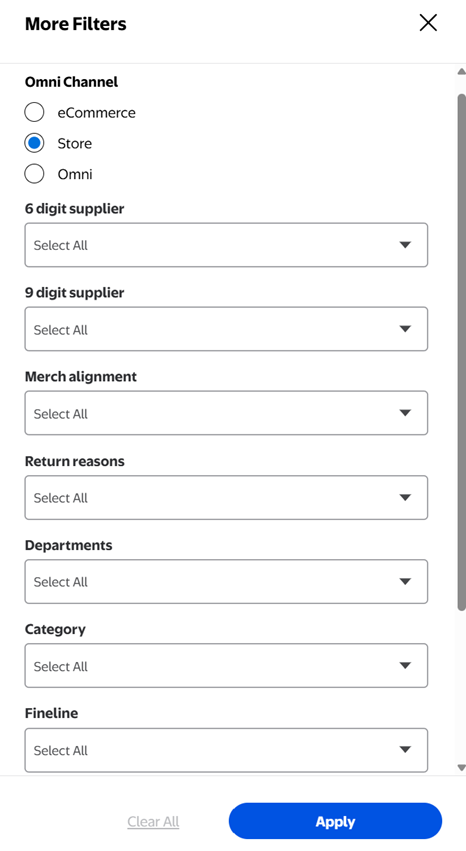
Click More filters to apply filters for specific criteria.

- For DSV: You can only filter by departments. Click the Apply button to view the returns for the departments you selected.
- For Owned: You can filter by Omni Channel (eCommerce, Store, Omni), 6-digit Supplier ID, 9-digit Supplier ID, Merch Alignment, Return reasons, Departments, Category, Fineline, and/or Buyer ID. Click the Apply button to view the returns or claims that match the criteria you selected.
Returns
Click the Customer Returns tab to gain insights that can help you understand why customers are initiating returns for items they ordered from you. Use these insights to identify item opportunities and reduce your return rates.
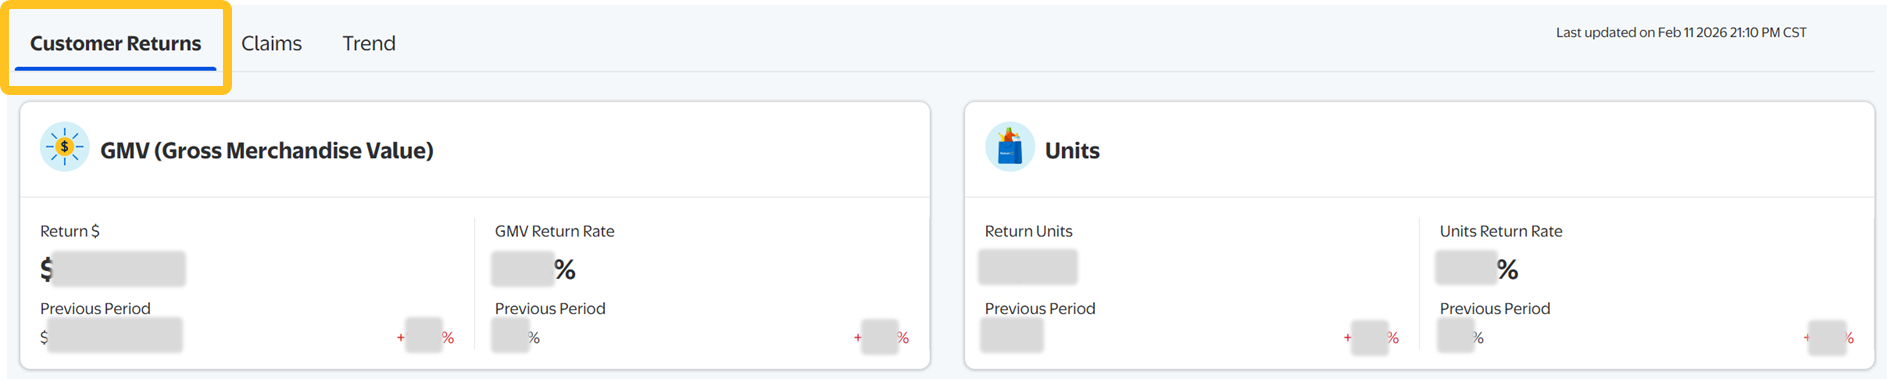
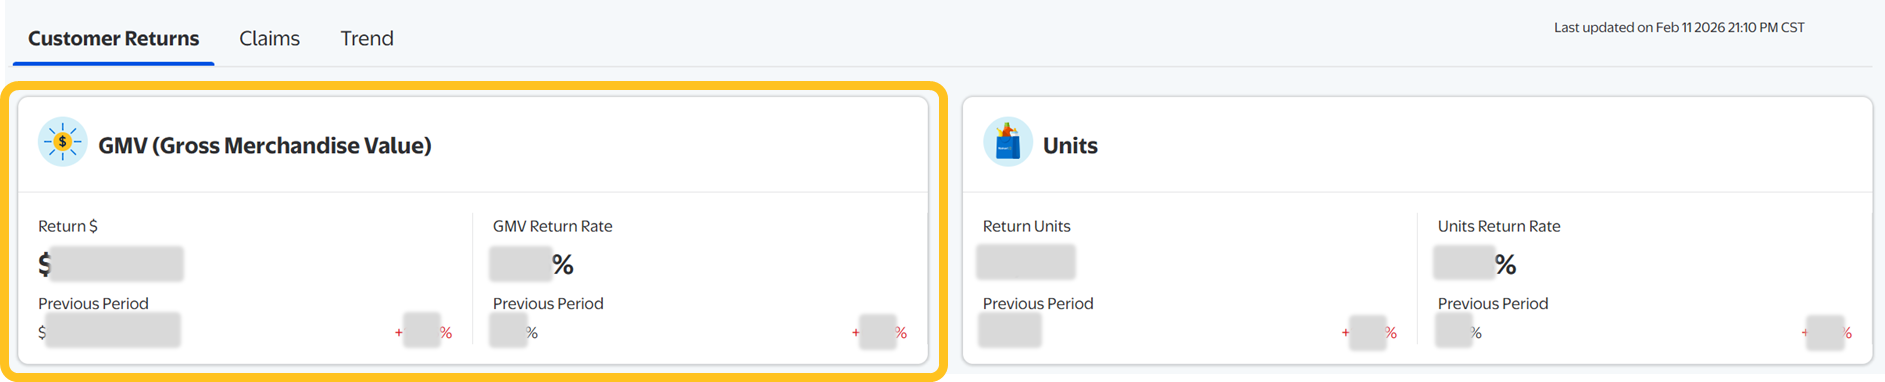
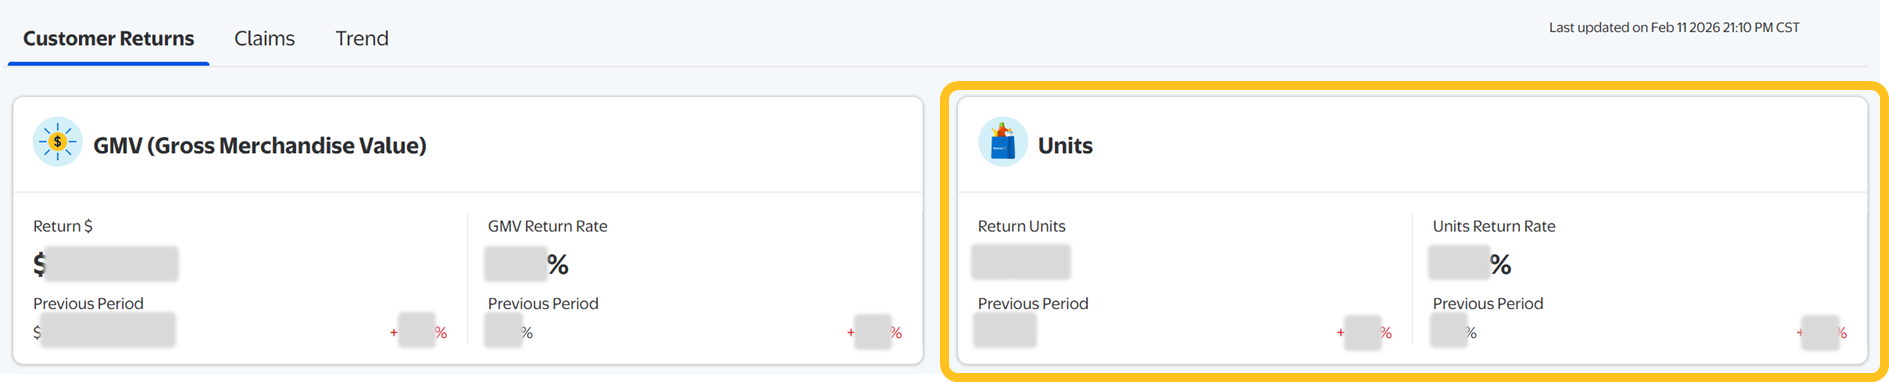
GMV (Gross Merchandise Value)
View the return $ and GMV return rate for the selected timeframe compared to the previous period.
Units
View the return units and units return rate for the selected timeframe compared to the previous period.
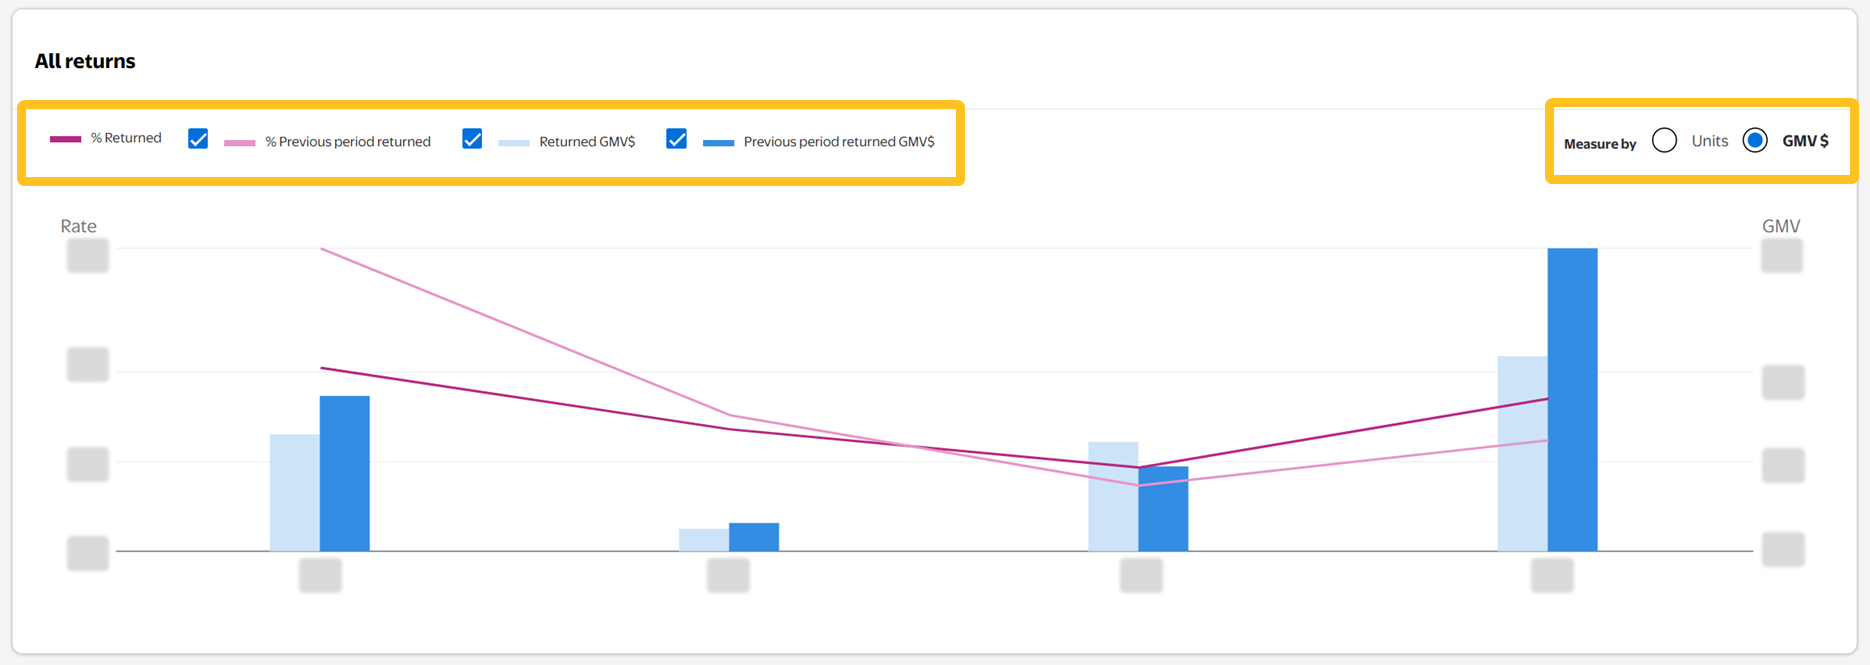
All Returns
Select units or GMV dollars to filter the results in the graph.
- Filter by units: The return rate is calculated as the number of return units initiated / the number of sales units shipped.
- Filter by GMV dollars: The return rate calculation as the dollar amount of returns initiated / the dollar amount of sales shipped.
- Customize the graph: Click the check box(es) to apply a year-by-year comparison.
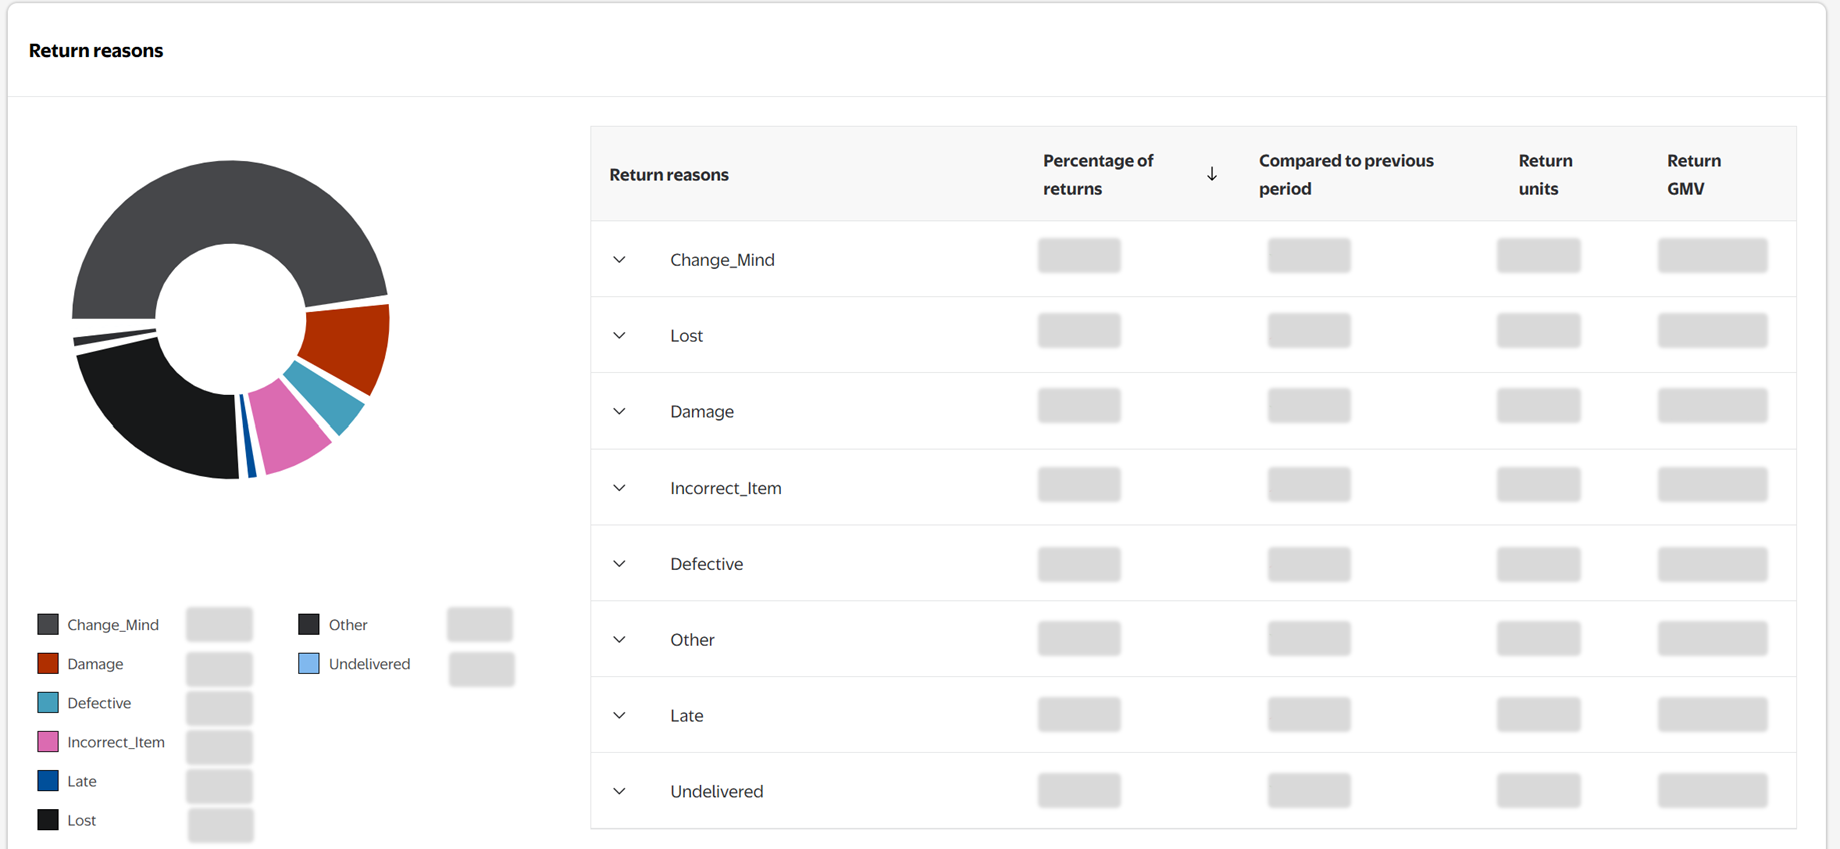
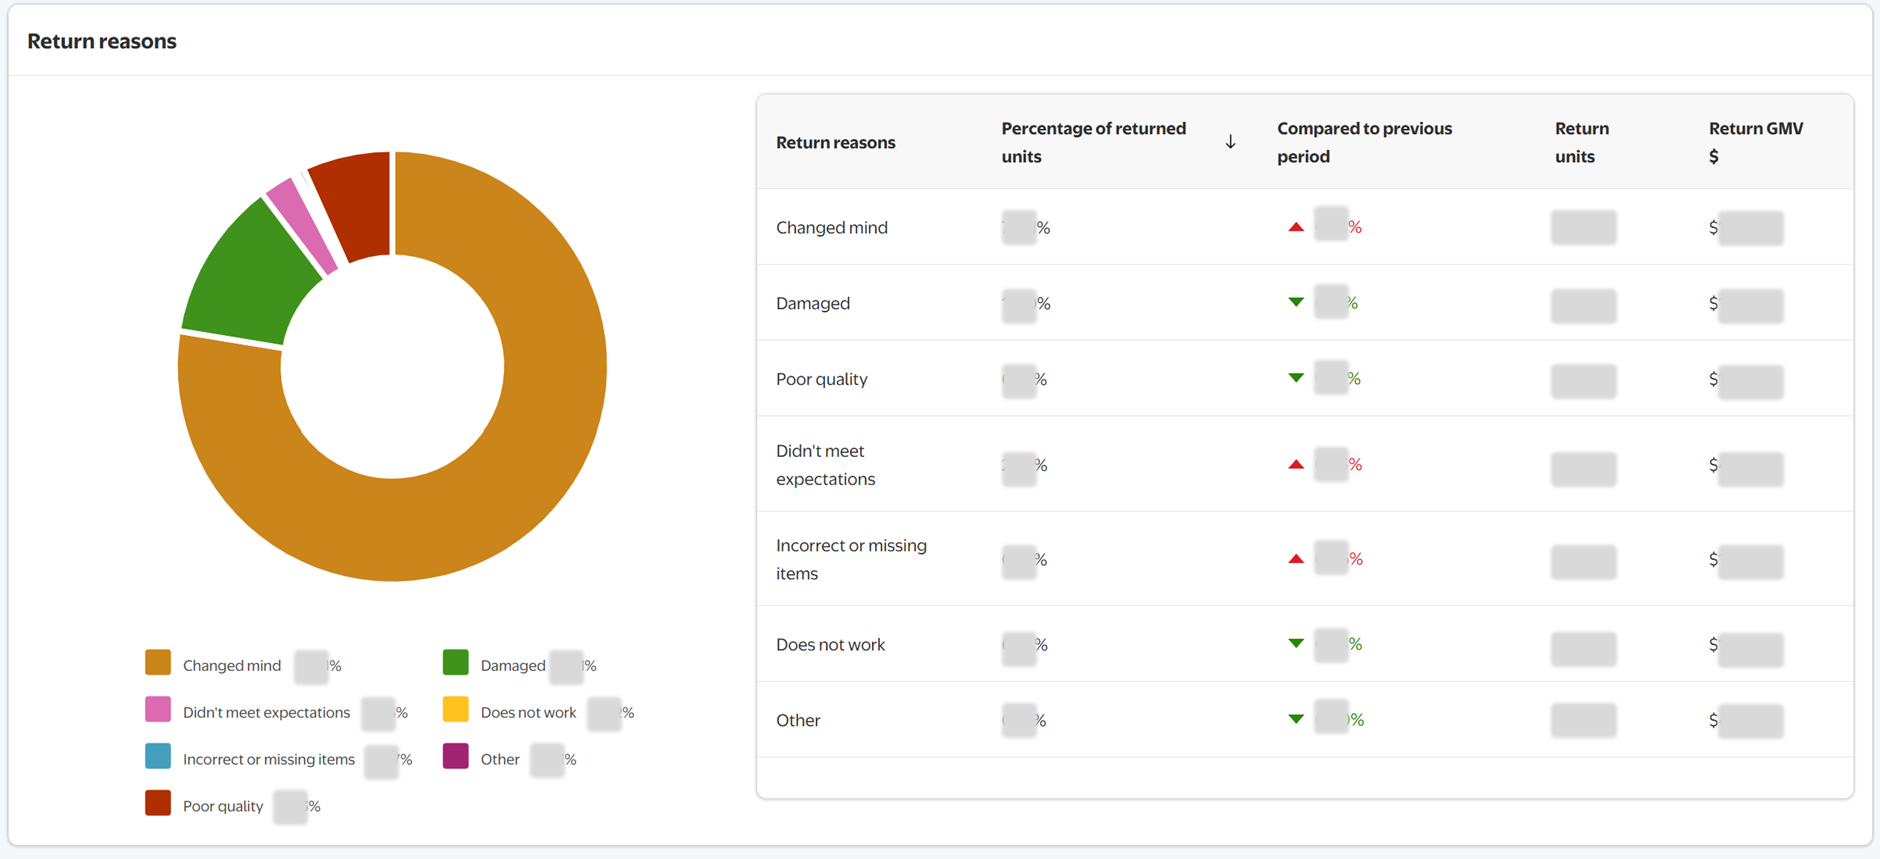
Return Reasons
This section breaks down your returns by the reason code selected by the customer. The table provides a breakdown of your total returns and the breakdown by reason. You will see the reason code, return units, return in dollars, percentage of returns for that reason code, and the percentage comparison of last year (for the same timeframe you set in the filters) and this year, if available.
- For DSV
- For Owned
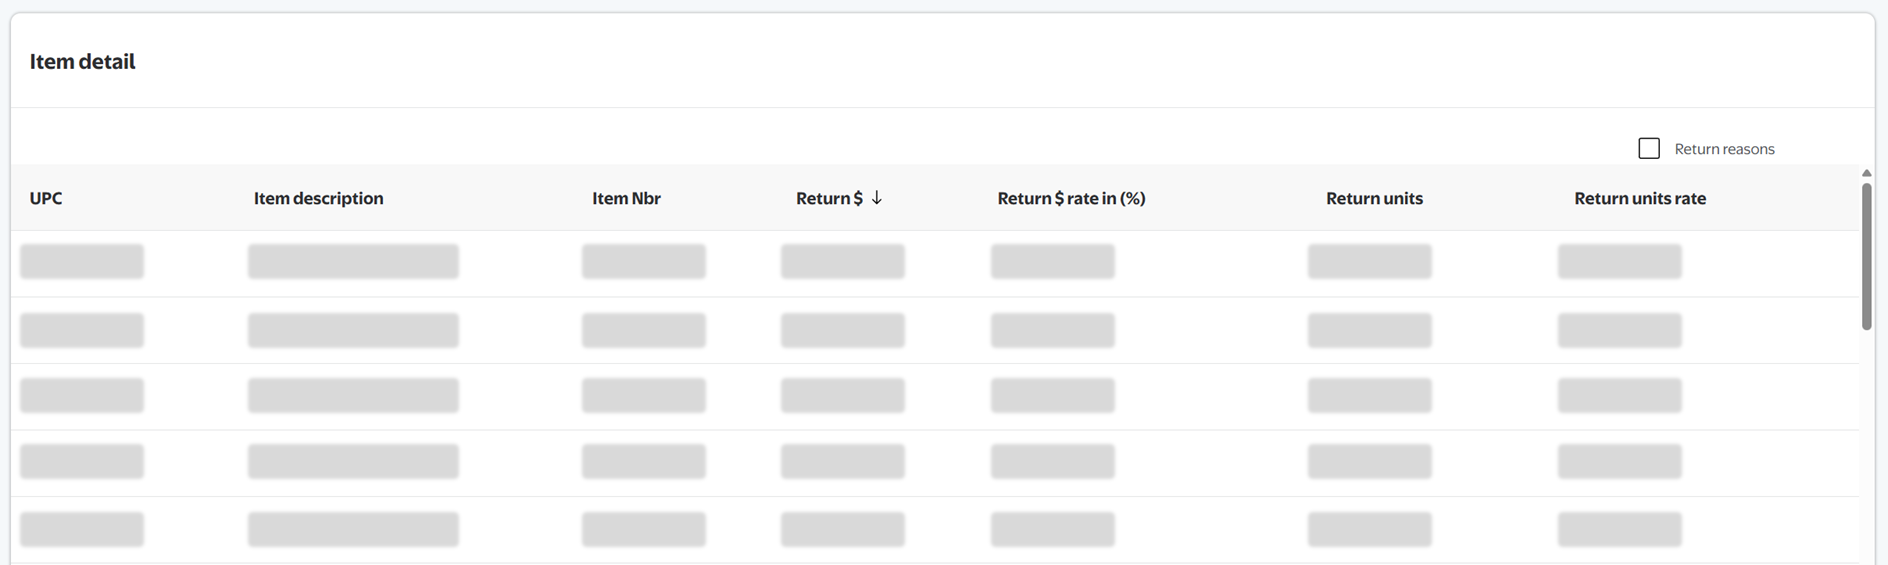
Item Details (Top Returned Items)
This section provides insights into the individual items being returned. By default, the table is filtered by the highest return $ to the lowest return $. You will see the UPC, Item Description, Walmart Item Number, Return $, Return Rate, Return Units, and Return Units Rate.
- For DSV: Click through the table pages to view additional items.
- For Owned: Scroll down the table to view additional items.You can click Return reasons check box to view item details by Return reason.
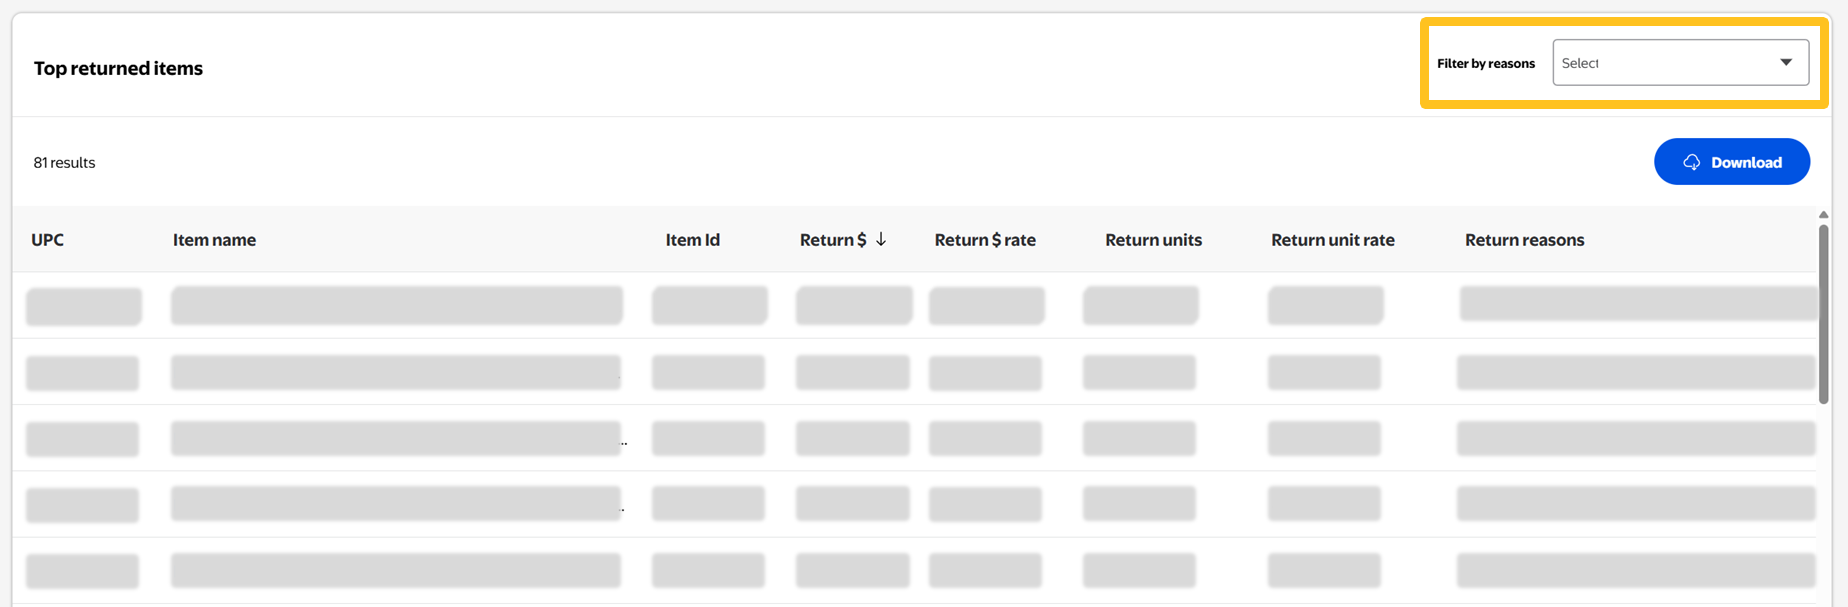
- For DSV: Click Filter by reasons to view top returned items by specific return reason(s).
Download Returns Data
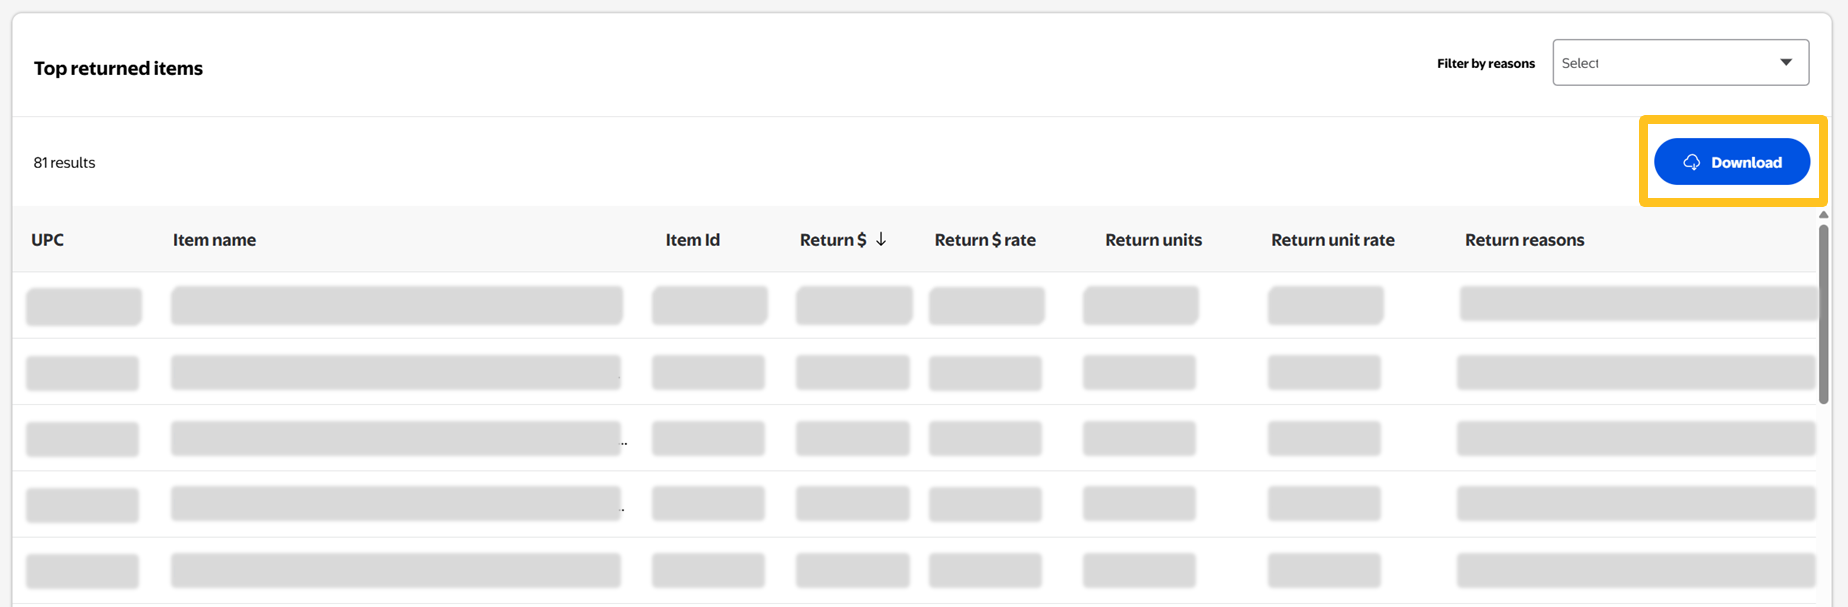
- For DSV: Click the Download button above the Item details table to export all items on this list.
- For Owned: Click the Download button at the top of the page to download a .csv or .pdf file of the returns data shown.
Claims
Click the Claims tab to gain insights into claims linked to your account.
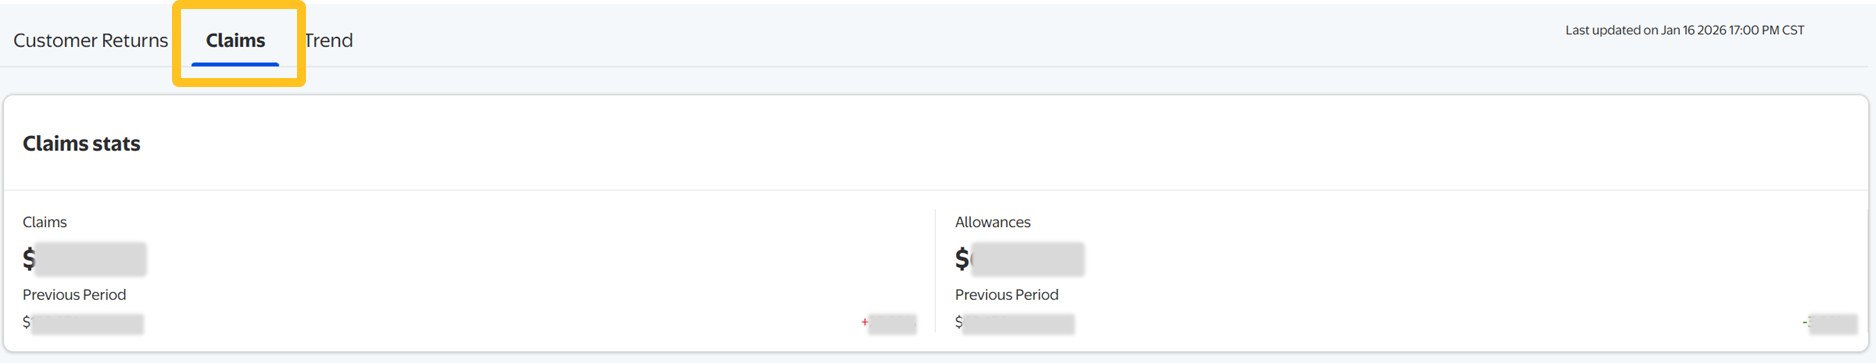
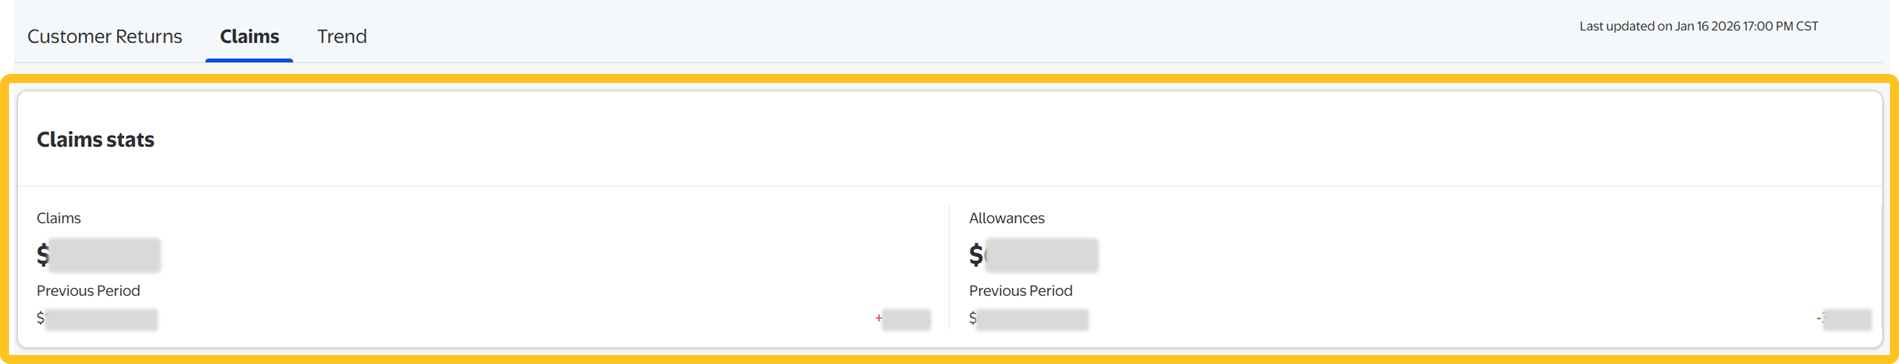
Claims Stats
Quickly view overall Claims and Allowances data for the selected time period, and compare it to the Previous Period data.
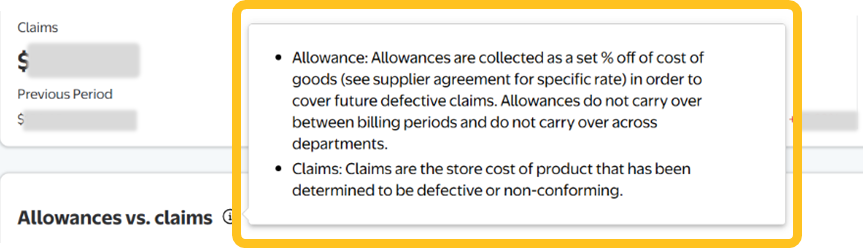
Allowances vs. Claims
The Allowances vs. claims graph shows you how claims per department are tracking compared to their allowances.
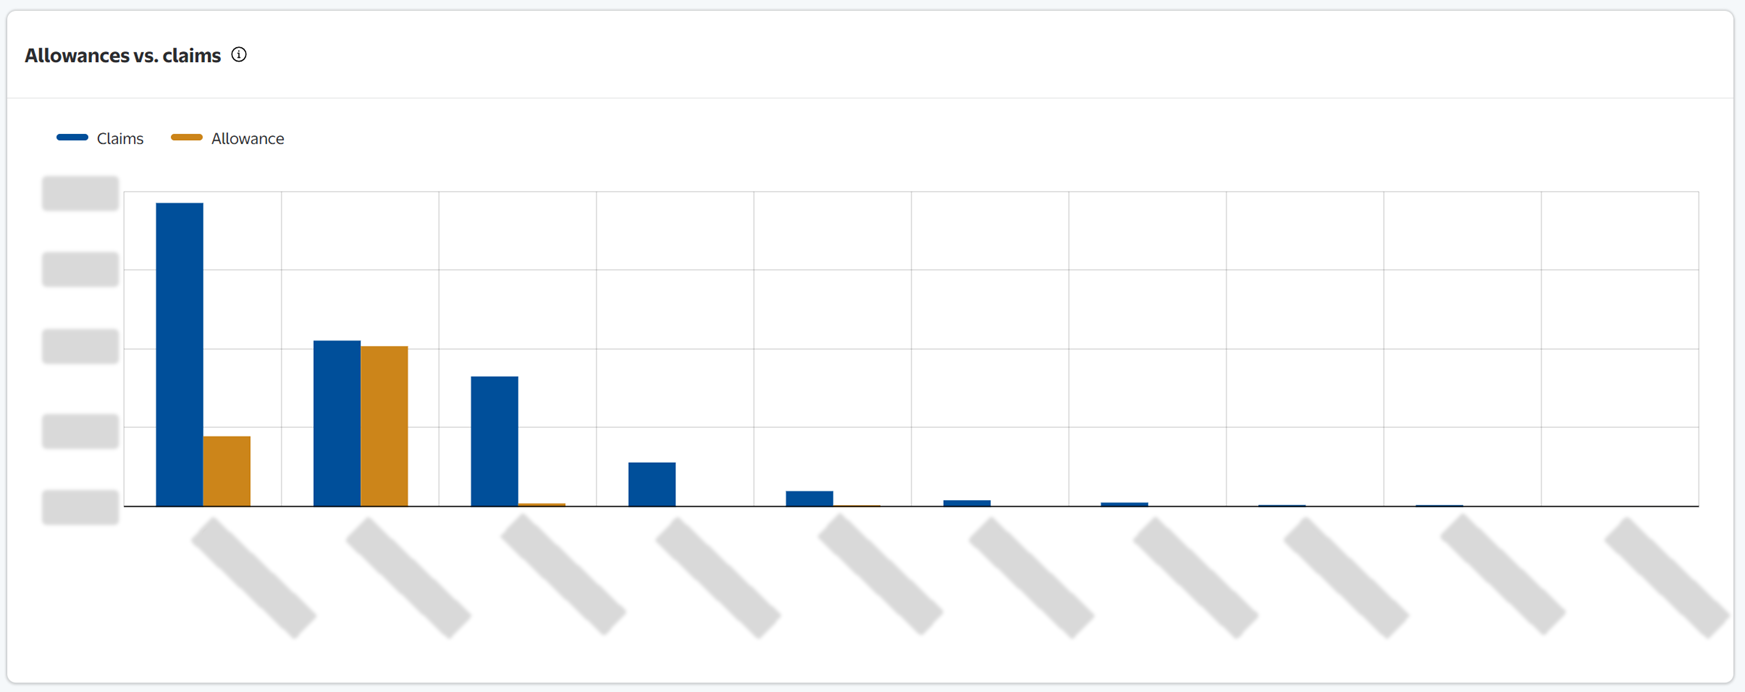
You will see two bars for each department:
- The burnt gold bar is for claims that occurred during the selected timeframe.
- The blue bar is for allowances collected during the selected timeframe.
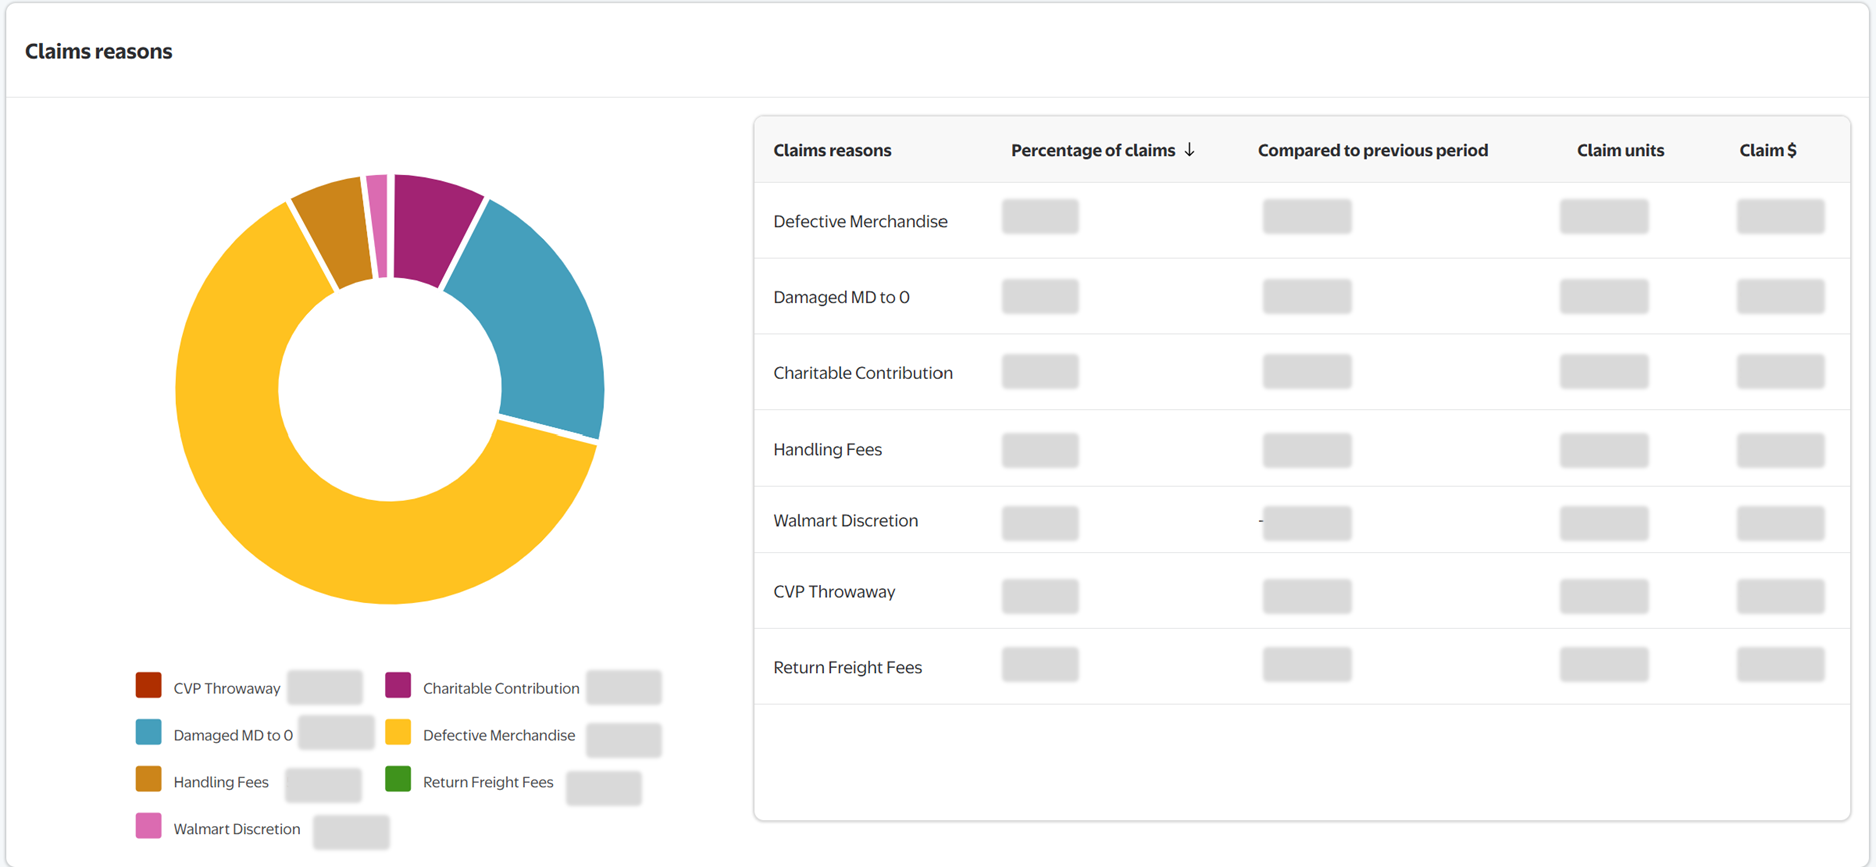
Claims Reasons
This section breaks down your claims by the reason code, including handling fees. The table provides a breakdown of your total claims and the breakdown by reason. You will see the reason code, the percentage comparison of last year (for the same timeframe you set in the filters), claim units, and claim dollars.
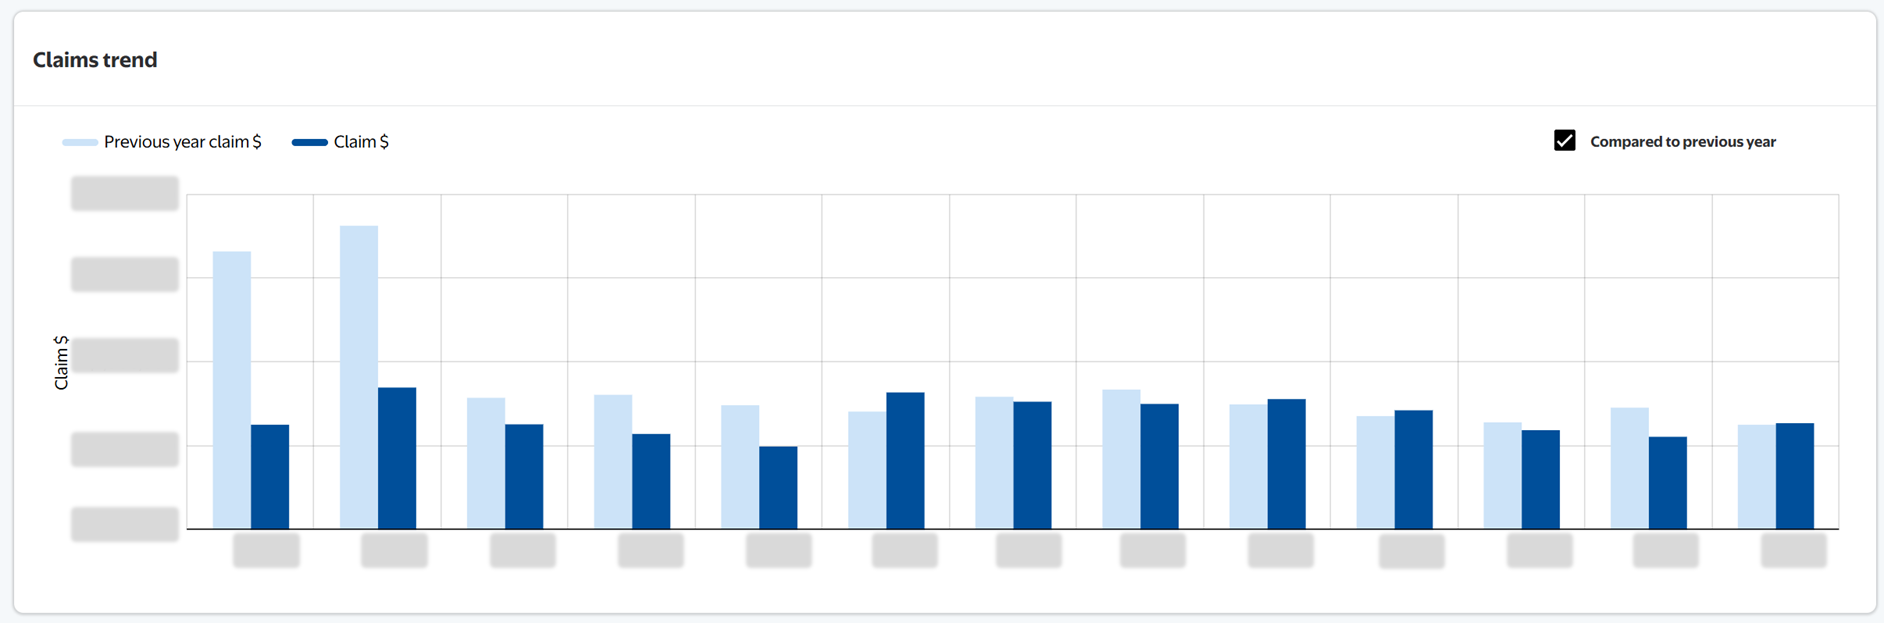
Claims Trend
This graph shows the claim dollar (Claim $) trend for the last six months. Click the check box at the top right corner to see the comparison to the previous year.
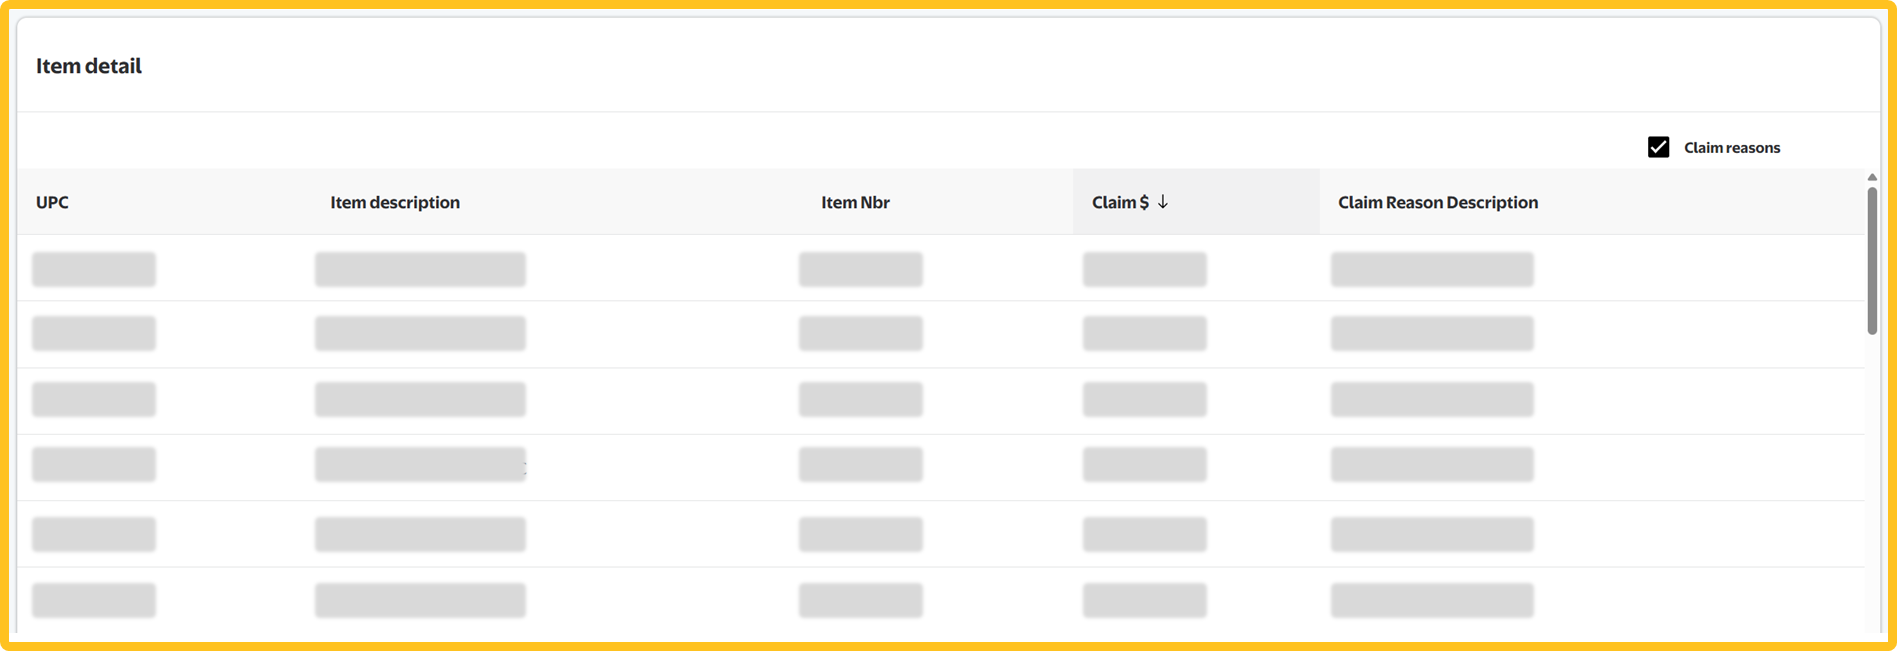
Item Details (Claims)
Claim $ is the dollar sum of claims for the item.
Download Claims Data
Click the Download button at the top of the page to download a .csv or .pdf file of the claims data.

Trend
Click the Trend tab to gain insights into omnichannel claims (both Store and eCommerce), allowances, and Last 52 Weeks (L52W) data linked to your 9-digit Supplier ID.
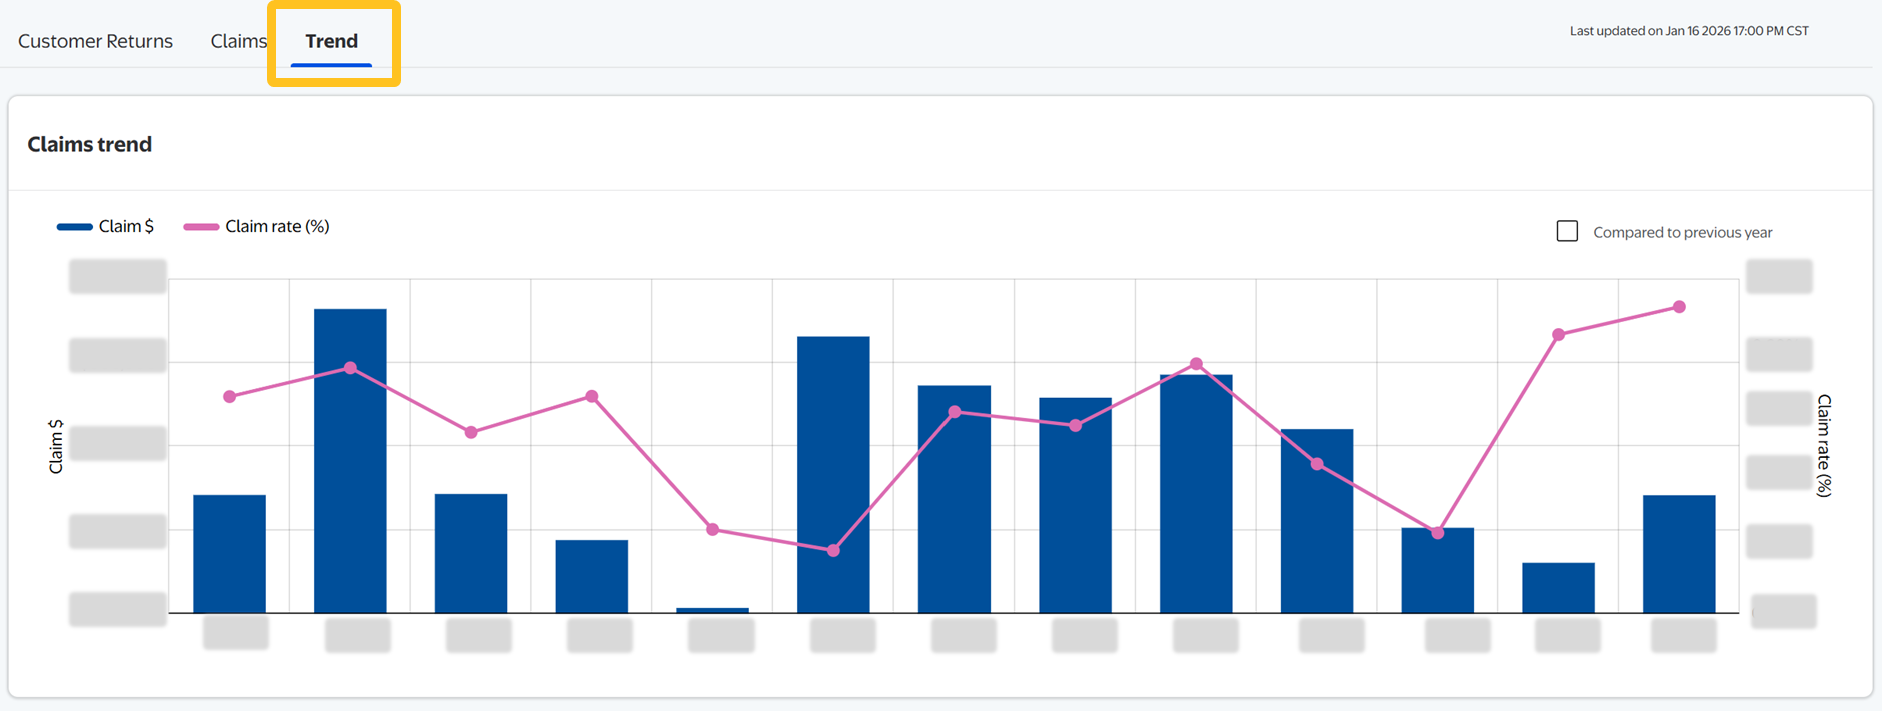
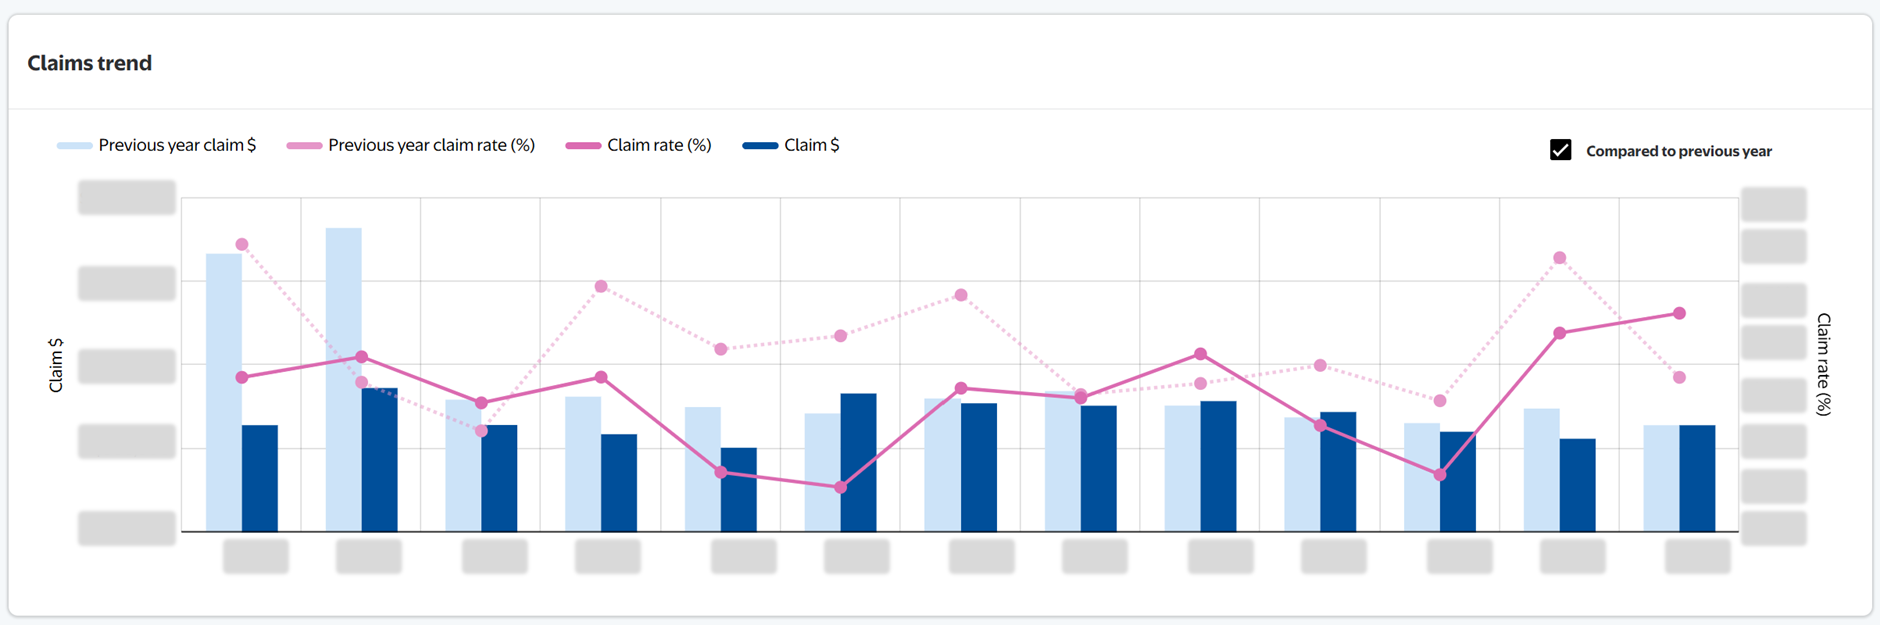
Claims Trend
This graph is the same as what's on the Claims tab except it is omnichannel (on the Claims tab, this graph is broken out by store or eCommerce channel).
Allowance Rate
The Allowance rate table shows the allowance rates for each 9-digit Supplier ID on your current contract as well as the L52W estimated allowance rate.
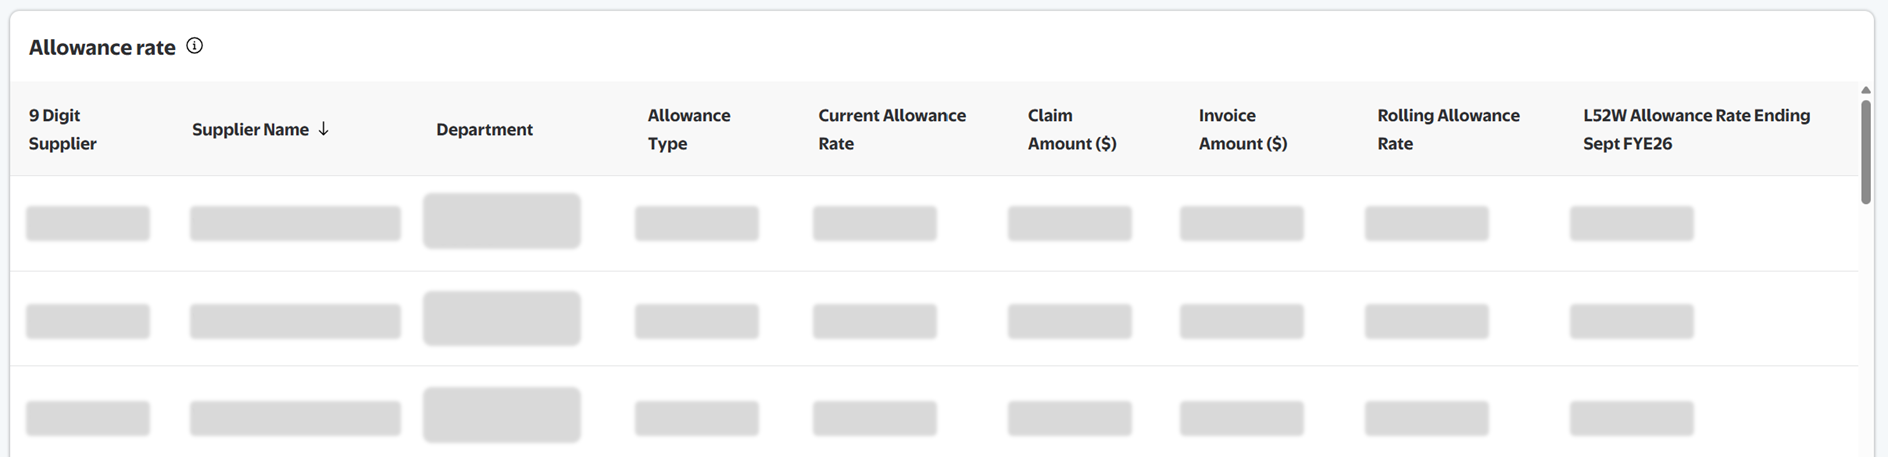
- Current allowance rate: The current allowance for your 9-digit Supplier ID(s).
- L52W estimated allowance rate: Your estimated Last 52 Week (L52W) allowance, which is the claim rate calculated at the 8-digit level (Total claim $/Total invoice amount).
- Invoice Amount ($): The Invoice Amount ($) for the L52W for your 9-digit Supplier ID(s).
Terminology
If you see an information icon next to a term (e.g., Allowances vs. claims), hover over it to learn more.
Below are terms and definitions related to returns:
Term | Definition |
Order Date | The date for a return is tied back to the date that the order was made.
|
Return $ | The total GMV dollar amount for items that were returned. |
Return $ Rate | The ratio of the return dollar amount in a time period and the total sales for that time period. |
Return Date | The date for a return is tied to the date that the return was initialized.
|
Return Units | The total units of returned items. |
Return Units Rate | The ratio of return units in a time period and the total sold units for that time period. |
Filter by Return Reasons (DSV)
Change Mind |
|
Damage |
|
Defective |
|
Incorrect Item |
|
Late |
|
Lost |
|
Missing Item |
|
Other |
|
Undelivered |
|
Have Questions or Need Help?
Support Level/Type | Example Use Cases | Contact |
Level 0 Support (GBS web form) | General questions, such as:
| Complete the form at https://wmgbs-support.custhelp.com/app/retail_link |
Level 1 Support (billing disputes) | Topics related to charges, such as:
| Email Post Audit at ClaimsARC-walmart@apexanalytix.com with the 9-digit claim number referencing the claim Level 2 Support will be contacted internally if Apex cannot resolve the issue |
Return Trends | Claims and Returns Scorecard Support | Bug / error reporting, such as:
| Click "Help" in the top navigation menu of Supplier One to manage tickets |